National Collegiate Athletic Association
NCAA News Archive - 2007
« back to 2007 | Back to NCAA News Archive Index
Three-year APR data show teams on incline
|
By Michelle Brutlag Hosick
The NCAA News
The NCAA News
The third year of Academic Progress Rate data released May 2 by the NCAA show improvement in almost all sports, including football and baseball, two sports that in the past posted rates causing some concern among the membership.
Overall penalties declined as well, from 3.6 percent of teams in both 2003-04 and 2004-05 to 3.3 percent in 2005-06. That percentage drop is due primarily to a decrease of more than 200 so-called “0-for-2s,” the student-athletes who earned neither the eligibility nor the retention points. Those are the players teams below the APR cutoff score of 925 cannot replace.
A total of 63 teams are subject to contemporaneous penalties only.
The average APR in the three-year data remained steady at about 960. Some of the overall improvement can be attributed to the raising of the statistical floor, since the lowest-performing teams improved in the 2005-06 data.
While this is the second year contemporaneous penalties have been assessed, it is the first year institutions will be subject to historically based penalties. In the first stage of that structure, teams with APRs below 900 will receive a public warning. That happened to 49 teams this year. If those same teams continue to fall below the 900 cut line with the collection of 2006-07 data, they will be subject to a variety of playing and practice season restrictions, based on a formula that includes a measurement of the team’s improvement over the last several years.
Eighteen teams are subject to both contemporaneous and historically based penalties.
Squad-size adjustment
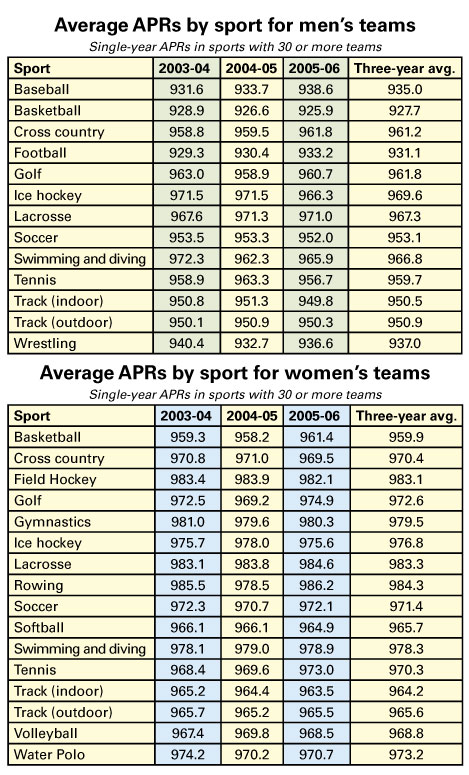
In football, the average rate began at 929.3 with the initial 2003-04 collection year. The most recent data, collected last fall for the 2005-06 academic year, show football’s rate has climbed to 933.2. The news in baseball is even better. Teams in that sport moved from 931.6 in the 2003-04 collection year to 938.6 in 2005-06.
The results are not so encouraging, though, in men’s basketball. While men’s basketball teams started out several points above the 925 cut line for penalties at 928.9, the most recent data show that sport has declined to 925.6. Those figures all represent rates for the individual collection year, not the three-year rolling rate for each sport. The three-year averages for football, baseball and men’s basketball are 931.1, 935 and 927.7, respectively.
Contemporaneous penalties are based on year-by-year APRs, while the historically based penalty structure relies on the rolling rate.
The third year of APR data collection continues to include a squad-size adjustment for teams in sports with smaller roster sizes. The adjustment gives teams a statistical “benefit of the doubt” that provides a more accurate picture of a team’s academic performance until the data set grows large enough to be reliable on its own. For many teams, that adjustment has meant the difference between being above or below 925 in the first three years of data collection. Beginning next year, though, the squad-size adjustment will be removed, since the data will be sufficient to render the adjustment unnecessary.
For example, only 3.5 percent of teams posted two-year APRs below 925 with the squad-size adjustment in place. Without the adjustment, 15.4 percent were below the mark required to avoid being subject to a contemporaneous penalty. The effects of removing the statistical safety net might be most apparent in men’s basketball.
In a conversation recorded for the Double-A Zone, the official NCAA blog, NCAA President Myles Brand said he was pleased with the APR improvement, particularly in baseball and football, but that there was work to be done in men’s basketball.
“We have realized improvement in some of the areas that needed it,” Brand said. “Football is up — that’s good. Perhaps the most pleasant surprise, though, is in baseball, which is up significantly. It’s not perfect — we’re still not where we want to be in men’s basketball. We have a lot of work to do there and it’s going to be a challenge.”
The challenge is that moving the rate up or down in any sport or on an individual team grows increasingly difficult as more years of APR data are compiled — the anchor of past behavior gets heavier and heavier as more data are collected.
NCAA Managing Director of Research Todd Petr said a simple analogy is with grade-point average. “After the first semester,” he said, “it might be easy to improve a low GPA because the data set is still small. But trying to improve a low GPA after four or more semesters is progressively more difficult because the poor grades make up more of the whole.”
The difference between GPA and APR, however, is that the APR is a rolling rate — after the fourth year of collection, the first year will drop off, and teams will be judged only on the most recent four years. The APR was created to be its most accurate as a rolling, four-year metric. Some teams will see drastic changes when their first year is dropped.
Kevin Lennon, NCAA vice president of membership services, said patterns are beginning to emerge in the academic performance data.
“Now that we have three years of APR data for every team, we can begin to discern initial trends in terms of academic performance. However the complete ‘package’ of academic reform, such as every student-athlete subject to higher progress-toward-degree standards and full implementation of historical penalties, has yet to be fully realized,” Lennon said. “We should have a clearer picture over the next few years.”
NCAA President Brand said the next year will be particularly telling for men’s basketball. He said the trend downward in that sport cannot be attributed completely to student-athletes who leave early for the NBA for a number of reasons, chiefly that teams are given a break in the APR metric if the student-athlete leaves in good academic standing.
“If there’s going to be a change in behavior, it has to happen soon. I want to make sure that those in the basketball community, particularly those who are not seeing a positive trend, have appropriate information and background to improve,” Brand said. “We’ve seen some positive stories — it’s not everybody moving backward. We just want a greater proportion of teams to be successful.”
Harsher penalties coming
So far, the overall rates for most sports have stabilized, which indicates the athletics community is paying attention to reform. Data show that the aggregate APR has stayed at or close to 960 for the last several years. Officials believe athletics administrators and coaches are more strategic in their recruiting of prospective student-athletes and more conscientious about retention once student-athletes are on campus.
Baseball, for example, has realized a significant improvement, which some people attribute to the fact that the Division I Board of Directors appointed a working group last year to recommend changes in the baseball environment. While those proposals weren’t approved until the most recent Board meeting (see story, page 1), many believe the national focus on baseball’s academic issues over the last 18 months got coaches talking and thinking about ways to improve their team’s APR.
Some people speculate the same thing could happen with basketball — the declining rate could spur presidents to take action. Brand says he doesn’t think presidents have any choice but to become involved, at least at the local level.
“Particularly in this high-visibility sport, academic performance is so important to the institution’s image and marketability to potential student applications that they can’t avoid taking steps to improve it,” he said.
Imposing implications loom if under-performing teams continue to lag, Brand said. The elimination of the squad-size safety net — combined with the start of the historically based penalty structure — should inspire teams to improve.
This year marks the first year historically based, or longer-term, penalties will be meted out. Though the first round consists only of a public warning — designed to be a kind of academic scarlet letter — the second year of historically based penalties includes a reduction in practice time and scholarships, depending on the team’s statistically based improvement over time.
After the second year, penalties will become progressively more severe, eventually banning teams from postseason play.
Overall penalties declined as well, from 3.6 percent of teams in both 2003-04 and 2004-05 to 3.3 percent in 2005-06. That percentage drop is due primarily to a decrease of more than 200 so-called “0-for-2s,” the student-athletes who earned neither the eligibility nor the retention points. Those are the players teams below the APR cutoff score of 925 cannot replace.
A total of 63 teams are subject to contemporaneous penalties only.
The average APR in the three-year data remained steady at about 960. Some of the overall improvement can be attributed to the raising of the statistical floor, since the lowest-performing teams improved in the 2005-06 data.
While this is the second year contemporaneous penalties have been assessed, it is the first year institutions will be subject to historically based penalties. In the first stage of that structure, teams with APRs below 900 will receive a public warning. That happened to 49 teams this year. If those same teams continue to fall below the 900 cut line with the collection of 2006-07 data, they will be subject to a variety of playing and practice season restrictions, based on a formula that includes a measurement of the team’s improvement over the last several years.
Eighteen teams are subject to both contemporaneous and historically based penalties.
Squad-size adjustment
In football, the average rate began at 929.3 with the initial 2003-04 collection year. The most recent data, collected last fall for the 2005-06 academic year, show football’s rate has climbed to 933.2. The news in baseball is even better. Teams in that sport moved from 931.6 in the 2003-04 collection year to 938.6 in 2005-06.
The results are not so encouraging, though, in men’s basketball. While men’s basketball teams started out several points above the 925 cut line for penalties at 928.9, the most recent data show that sport has declined to 925.6. Those figures all represent rates for the individual collection year, not the three-year rolling rate for each sport. The three-year averages for football, baseball and men’s basketball are 931.1, 935 and 927.7, respectively.
Contemporaneous penalties are based on year-by-year APRs, while the historically based penalty structure relies on the rolling rate.
The third year of APR data collection continues to include a squad-size adjustment for teams in sports with smaller roster sizes. The adjustment gives teams a statistical “benefit of the doubt” that provides a more accurate picture of a team’s academic performance until the data set grows large enough to be reliable on its own. For many teams, that adjustment has meant the difference between being above or below 925 in the first three years of data collection. Beginning next year, though, the squad-size adjustment will be removed, since the data will be sufficient to render the adjustment unnecessary.
For example, only 3.5 percent of teams posted two-year APRs below 925 with the squad-size adjustment in place. Without the adjustment, 15.4 percent were below the mark required to avoid being subject to a contemporaneous penalty. The effects of removing the statistical safety net might be most apparent in men’s basketball.
In a conversation recorded for the Double-A Zone, the official NCAA blog, NCAA President Myles Brand said he was pleased with the APR improvement, particularly in baseball and football, but that there was work to be done in men’s basketball.
“We have realized improvement in some of the areas that needed it,” Brand said. “Football is up — that’s good. Perhaps the most pleasant surprise, though, is in baseball, which is up significantly. It’s not perfect — we’re still not where we want to be in men’s basketball. We have a lot of work to do there and it’s going to be a challenge.”
The challenge is that moving the rate up or down in any sport or on an individual team grows increasingly difficult as more years of APR data are compiled — the anchor of past behavior gets heavier and heavier as more data are collected.
NCAA Managing Director of Research Todd Petr said a simple analogy is with grade-point average. “After the first semester,” he said, “it might be easy to improve a low GPA because the data set is still small. But trying to improve a low GPA after four or more semesters is progressively more difficult because the poor grades make up more of the whole.”
The difference between GPA and APR, however, is that the APR is a rolling rate — after the fourth year of collection, the first year will drop off, and teams will be judged only on the most recent four years. The APR was created to be its most accurate as a rolling, four-year metric. Some teams will see drastic changes when their first year is dropped.
Kevin Lennon, NCAA vice president of membership services, said patterns are beginning to emerge in the academic performance data.
“Now that we have three years of APR data for every team, we can begin to discern initial trends in terms of academic performance. However the complete ‘package’ of academic reform, such as every student-athlete subject to higher progress-toward-degree standards and full implementation of historical penalties, has yet to be fully realized,” Lennon said. “We should have a clearer picture over the next few years.”
NCAA President Brand said the next year will be particularly telling for men’s basketball. He said the trend downward in that sport cannot be attributed completely to student-athletes who leave early for the NBA for a number of reasons, chiefly that teams are given a break in the APR metric if the student-athlete leaves in good academic standing.
“If there’s going to be a change in behavior, it has to happen soon. I want to make sure that those in the basketball community, particularly those who are not seeing a positive trend, have appropriate information and background to improve,” Brand said. “We’ve seen some positive stories — it’s not everybody moving backward. We just want a greater proportion of teams to be successful.”
Harsher penalties coming
So far, the overall rates for most sports have stabilized, which indicates the athletics community is paying attention to reform. Data show that the aggregate APR has stayed at or close to 960 for the last several years. Officials believe athletics administrators and coaches are more strategic in their recruiting of prospective student-athletes and more conscientious about retention once student-athletes are on campus.
Baseball, for example, has realized a significant improvement, which some people attribute to the fact that the Division I Board of Directors appointed a working group last year to recommend changes in the baseball environment. While those proposals weren’t approved until the most recent Board meeting (see story, page 1), many believe the national focus on baseball’s academic issues over the last 18 months got coaches talking and thinking about ways to improve their team’s APR.
Some people speculate the same thing could happen with basketball — the declining rate could spur presidents to take action. Brand says he doesn’t think presidents have any choice but to become involved, at least at the local level.
“Particularly in this high-visibility sport, academic performance is so important to the institution’s image and marketability to potential student applications that they can’t avoid taking steps to improve it,” he said.
Imposing implications loom if under-performing teams continue to lag, Brand said. The elimination of the squad-size safety net — combined with the start of the historically based penalty structure — should inspire teams to improve.
This year marks the first year historically based, or longer-term, penalties will be meted out. Though the first round consists only of a public warning — designed to be a kind of academic scarlet letter — the second year of historically based penalties includes a reduction in practice time and scholarships, depending on the team’s statistically based improvement over time.
After the second year, penalties will become progressively more severe, eventually banning teams from postseason play.
© 2010 The National Collegiate Athletic Association
Terms and Conditions | Privacy Policy