National Collegiate Athletic Association
NCAA News Archive - 2007
« back to 2007 | Back to NCAA News Archive Index
Fan frenzy
College football basks in glow of record-setting attendance for 2006 season
College football basks in glow of record-setting attendance for 2006 season
|
By Gary K. Johnson
The NCAA News
The NCAA News
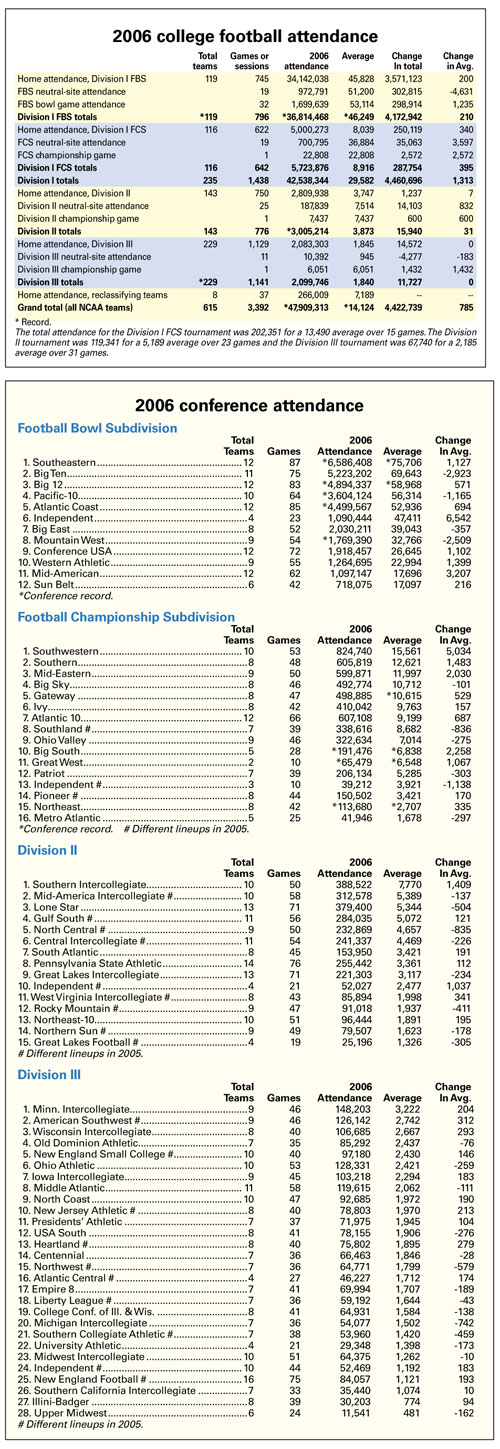
NCAA football attendance set a new standard during the 2006 season as 615 schools combined for a total gate of 47,909,313, shattering the 2003 record by 1,764,774 fans.
The permanent addition of the 12th regular-season game in the Division I Football Bowl Subdivision (formerly Division I-A) certainly had the potential to boost total attendance to an all-time high, but perhaps a more significant indication of the sport’s popularity is that the average-per-game mark was broken in both the FBS and for all divisions combined.
The average number of fans attending an FBS game in 2006 was 46,249, better than the record mark of 46,039 per game in 2005. For all divisions combined, the 2006 per-game average of 14,124 topped the 22-year-old record of 13,852 set in 1984 and was a one-year jump of nearly 1,000 more fans per game than in 2005.
The FBS set a record in overall attendance, too (counting neutral-site games and bowls), as 36,814,468 people came through the turnstiles in 2006. The previous high in that subdivision was 35,085,646 in 2003, the last season FBS schools played 12 regular-season games.
Previous legislation for FBS schools allowed for 12 games during years in which the calendar accommodated an extra week in the playing season. The next such season was to be in 2008, but the Division I Board of Directors approved the permanent 12th game in April 2005 to begin with the 2006 campaign.
Presidents in the Football Championship Subdivision (formerly Division I-AA) recently defeated a proposal that would have allowed for a 12th game in that subdivision.
Division II also set a total-attendance record, topping three million fans for the first time (3,005,214) and eclipsing the mark of 2,989,274 set in 2005.
Although all-time records were not set in the FCS and Division III, both classifications were up from 2005. The 5,723,876 fans at FCS games in 2006 was the fourth-highest total in that subdivision and was up 395 fans per game from the previous year.
Division III realized an increase of 11,727 fans from 2005 to 2,099,746 in 2006. Coincidentally, the average number of fans per game (1,840) matched the number from 2005.
In other notes from Division I:
The FBS postseason featured four more bowl games. The 32 games totaled 1,699,639 spectators for an average of 53,114 fans per contest.
The eight football-playing reclassifying teams, which are NCAA schools in the process of moving from one division to another, totaled 266,009 home fans for a 7,189 average this season.
Individual attendance
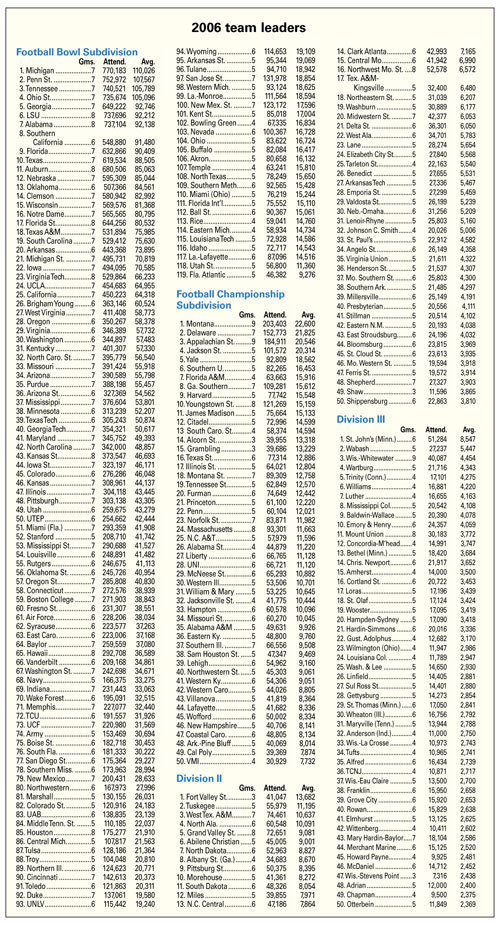
Michigan’s 110,026 fans per game over seven home contests topped Penn State’s 107,567 to give the Wolverines their ninth straight attendance title. Two other schools also topped the 100,000 mark: Tennessee at 105,789 and Ohio State at 105,096. The all-time record is 111,175 by Michigan in 1999.
Michigan was the first to average more than 100,000 a game in 1976 and has captured the attendance title 37 times since 1949, including 31 since 1974.
In total attendance, Michigan led with 770,183, followed by Penn State’s 752,972, Tennessee’s 740,521 and Ohio State’s 735,674. All four schools played seven home games in 2006.
As for league totals, the Southeastern Conference set NCAA conference records for total and average attendance while topping all conferences for the ninth consecutive year. While the Big Ten Conference boasted three of the nation’s top four teams in per-game attendance, the SEC claimed six of the top 11 spots. The Pacific-10 and Big 12 each provided one team in the top 10.
The SEC totaled 6,586,408 fans while averaging 75,706 per game. That broke the mark of 74,579 set by the SEC in 2005, and the total topped the SEC’s record of 6,146,890 in 2003.
The Big Ten, Big 12, Pacific-10 and Atlantic Coast rounded out the top five for conference attendance. The SEC, Big 12, Pacific-10, ACC and Mountain West all set league bests in total attendance. The Big 12 was the only conference other than the SEC to top its previous high for fans per game.
Other classifications
Montana’s attendance total of 203,403 was the most of any Division I FCS team. The Grizzlies’ average of 22,600 fans per game edged Delaware’s 21,825.
In the FCS conference race, the Southwestern Athletic Conference returned to the top spot with 15,561 fans per game, almost 3,000 more per game than the Southern Conference, which snapped the SWAC’s 27-year grip on the title in 2005. The rest of the top five were the Mid-Eastern (11,997), Big Sky (10,712) and Gateway (10,615).
Three conferences — the Big South, Great West and Northeast — had personal highs for total attendance. Those three also topped their average bests, as did the Gateway.
In Division II, Fort Valley State averaged 13,682 fans per game to capture the attendance title. Tuskegee was a distant second at 11,195, followed by West Texas A&M (10,637), North Alabama (10,091) and Grand Valley State (9,081).
The Southern Intercollegiate Athletic Conference took its fourth consecutive conference Division II league crown by averaging 7,770 per game for its 10 members. The Mid-America Intercollegiate Athletic Association finished second at 5,389 per outing and the Lone Star Conference was third at 5,344.
In Division III, St. John’s (Minnesota) ran away with its fourth attendance title in five years by averaging 8,547 per game. The rest of the top five were Wabash (5,447), Wisconsin-Whitewater (4,454), Wartburg (4,343) and Trinity (Connecticut) (4,275).
The Minnesota Intercollegiate Conference took its second straight Division III league attendance title as its nine teams averaged 3,222 fans a game and totaled a Division III-best 148,203 fans. The American Southwest Conference took second at 2,742 fans per game, followed by the Wisconsin Intercollegiate Conference (2,667), Old Dominion Conference (2,437) and New England Small College Conference (2,430).
The permanent addition of the 12th regular-season game in the Division I Football Bowl Subdivision (formerly Division I-A) certainly had the potential to boost total attendance to an all-time high, but perhaps a more significant indication of the sport’s popularity is that the average-per-game mark was broken in both the FBS and for all divisions combined.
The average number of fans attending an FBS game in 2006 was 46,249, better than the record mark of 46,039 per game in 2005. For all divisions combined, the 2006 per-game average of 14,124 topped the 22-year-old record of 13,852 set in 1984 and was a one-year jump of nearly 1,000 more fans per game than in 2005.
The FBS set a record in overall attendance, too (counting neutral-site games and bowls), as 36,814,468 people came through the turnstiles in 2006. The previous high in that subdivision was 35,085,646 in 2003, the last season FBS schools played 12 regular-season games.
Previous legislation for FBS schools allowed for 12 games during years in which the calendar accommodated an extra week in the playing season. The next such season was to be in 2008, but the Division I Board of Directors approved the permanent 12th game in April 2005 to begin with the 2006 campaign.
Presidents in the Football Championship Subdivision (formerly Division I-AA) recently defeated a proposal that would have allowed for a 12th game in that subdivision.
Division II also set a total-attendance record, topping three million fans for the first time (3,005,214) and eclipsing the mark of 2,989,274 set in 2005.
Although all-time records were not set in the FCS and Division III, both classifications were up from 2005. The 5,723,876 fans at FCS games in 2006 was the fourth-highest total in that subdivision and was up 395 fans per game from the previous year.
Division III realized an increase of 11,727 fans from 2005 to 2,099,746 in 2006. Coincidentally, the average number of fans per game (1,840) matched the number from 2005.
In other notes from Division I:
The FBS postseason featured four more bowl games. The 32 games totaled 1,699,639 spectators for an average of 53,114 fans per contest.
The eight football-playing reclassifying teams, which are NCAA schools in the process of moving from one division to another, totaled 266,009 home fans for a 7,189 average this season.
Individual attendance
Michigan’s 110,026 fans per game over seven home contests topped Penn State’s 107,567 to give the Wolverines their ninth straight attendance title. Two other schools also topped the 100,000 mark: Tennessee at 105,789 and Ohio State at 105,096. The all-time record is 111,175 by Michigan in 1999.
Michigan was the first to average more than 100,000 a game in 1976 and has captured the attendance title 37 times since 1949, including 31 since 1974.
In total attendance, Michigan led with 770,183, followed by Penn State’s 752,972, Tennessee’s 740,521 and Ohio State’s 735,674. All four schools played seven home games in 2006.
As for league totals, the Southeastern Conference set NCAA conference records for total and average attendance while topping all conferences for the ninth consecutive year. While the Big Ten Conference boasted three of the nation’s top four teams in per-game attendance, the SEC claimed six of the top 11 spots. The Pacific-10 and Big 12 each provided one team in the top 10.
The SEC totaled 6,586,408 fans while averaging 75,706 per game. That broke the mark of 74,579 set by the SEC in 2005, and the total topped the SEC’s record of 6,146,890 in 2003.
The Big Ten, Big 12, Pacific-10 and Atlantic Coast rounded out the top five for conference attendance. The SEC, Big 12, Pacific-10, ACC and Mountain West all set league bests in total attendance. The Big 12 was the only conference other than the SEC to top its previous high for fans per game.
Other classifications
Montana’s attendance total of 203,403 was the most of any Division I FCS team. The Grizzlies’ average of 22,600 fans per game edged Delaware’s 21,825.
In the FCS conference race, the Southwestern Athletic Conference returned to the top spot with 15,561 fans per game, almost 3,000 more per game than the Southern Conference, which snapped the SWAC’s 27-year grip on the title in 2005. The rest of the top five were the Mid-Eastern (11,997), Big Sky (10,712) and Gateway (10,615).
Three conferences — the Big South, Great West and Northeast — had personal highs for total attendance. Those three also topped their average bests, as did the Gateway.
In Division II, Fort Valley State averaged 13,682 fans per game to capture the attendance title. Tuskegee was a distant second at 11,195, followed by West Texas A&M (10,637), North Alabama (10,091) and Grand Valley State (9,081).
The Southern Intercollegiate Athletic Conference took its fourth consecutive conference Division II league crown by averaging 7,770 per game for its 10 members. The Mid-America Intercollegiate Athletic Association finished second at 5,389 per outing and the Lone Star Conference was third at 5,344.
In Division III, St. John’s (Minnesota) ran away with its fourth attendance title in five years by averaging 8,547 per game. The rest of the top five were Wabash (5,447), Wisconsin-Whitewater (4,454), Wartburg (4,343) and Trinity (Connecticut) (4,275).
The Minnesota Intercollegiate Conference took its second straight Division III league attendance title as its nine teams averaged 3,222 fans a game and totaled a Division III-best 148,203 fans. The American Southwest Conference took second at 2,742 fans per game, followed by the Wisconsin Intercollegiate Conference (2,667), Old Dominion Conference (2,437) and New England Small College Conference (2,430).
© 2010 The National Collegiate Athletic Association
Terms and Conditions | Privacy Policy