National Collegiate Athletic Association
NCAA News Archive - 2006
« back to 2006 | Back to NCAA News Archive Index
Addition of 12th game next season figures to boost already high totals
|
The NCAA News
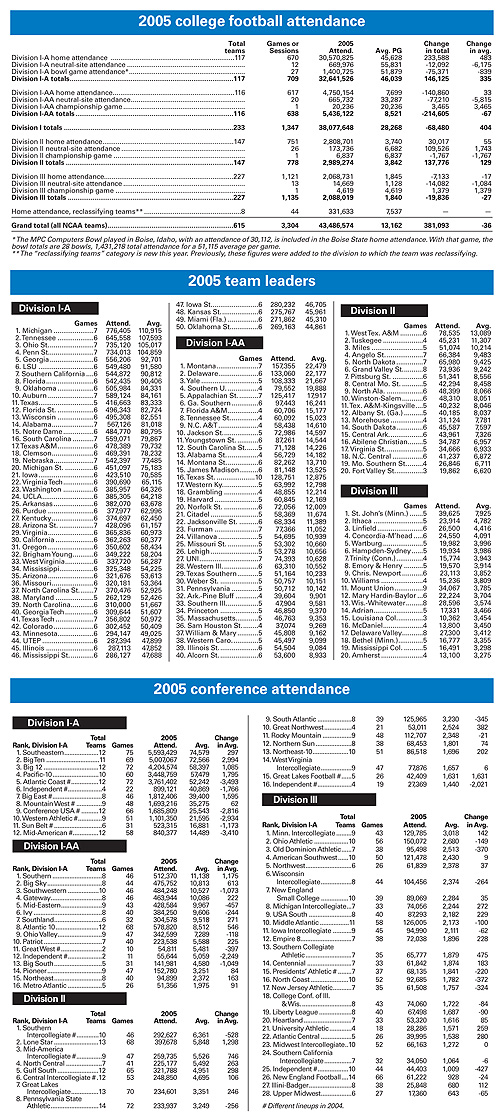
A surge in Division I-A and a record-setting year in Division II led to increased attendance totals in college football for the 2005 season.
While total attendance was up by 381,093 fans from last season, the per-game average actually dropped slightly — but it still topped the 13,000 mark for the fourth straight year.
The 615 NCAA teams totaled 43,486,574 fans for all four divisions in 2005. That is the third-highest recorded since the NCAA began tracking attendance in 1948. The all-time high of 46,114,539 was set during the 2003 season when, because of the way the calendar fell that year, Divisions I-A and I-AA institutions were permitted to play 12 games, one more contest each than had usually been allowed.
Division I-A approved legislation to play a 12th regular-season game annually beginning next year. Division I-AA will act on a similar proposal this spring.
In Division I-A this past season, overall attendance (counting neutral-site games and bowls) was 32,641,526, up 146,125 fans from 2004, while the per-game average jumped by 335 to 46,039. Division I-AA had a total of 5,436,122 fans, a drop of 214,605, and the per-game attendance was 8,521, down 67 from 2004.
Division II enjoyed record crowds as 2,989,274 fans passed through the turnstiles, breaking the 27-year mark of 2,871,683 set in 1978, the first year Division II attendance was kept. The 2005 average per game in Division II was 3,842, up 129 fans per game from 2004.
Division III attendance dropped slightly but eclipsed two million fans for the third straight year. The 2,088,019 people attending games in 2005 was down 19,836 in total number but down only 27 fans per game.
The Division I-A postseason again featured 28 bowl games, which averaged 51,115 fans per contest. The 30,112 fans who attended the MPC Computers Bowl played at
Reclassifying teams were given their own category in this year’s attendance report. The eight teams reclassifying this year totaled 331,633 home fans for a 7,537 average.
In total attendance,
As for league totals, the Southeastern Conference won the attendance crown for an eighth consecutive year. While the Big Ten Conference boasted three of the nation’s top four teams in per-game attendance, the SEC claimed half the top 10. The Pacific-10 and Big 12 each had one team in the top 10.
The SEC totaled 5,593,429 fans while setting an all-time conference record of 74,579 fans per game. That broke the SEC’s own mark of 74,282 set in 2004. The Big Ten also topped the five-million level, and its 72,566 per-game average represented only the ninth time any league had topped the 70,000 per-game mark.
The Big 12, Pacific-10 and Atlantic Coast Conferences rounded out the top five.
Divisions I-AA, II and III totals
In league totals, the Southern Conference snapped the Southwestern Athletic Conference’s 27-year grip on the title. The top five were the Southern (11,138), Big Sky (10,813), SWAC (10,527), Gateway (10,086) and Mid-Eastern (9,967). The 12 teams of the Atlantic 10 produced the most total fans at 578,820.
In Division II, West Texas A&M averaged 13,089 fans per game to capture the attendance title.
The Southern Intercollegiate Athletic Conference (SIAC) took its third consecutive Division II league crown by averaging 6,361 per game for its 10 members. The Lone Star Conference finished second at 5,848 per outing and the Mid-America Intercollegiate Athletic Association was third at 5,526.
In Division III,
The Minnesota Intercollegiate Conference took its first Division III league attendance title as its nine teams averaged 3,018 fans per game. The Ohio Athletic Conference, which won two of the last three attendance titles, took second at 2,680 fans per game while totaling a Division III-best 150,072 fans. The Old Dominion Conference, on top for 13 of the past 15 years, dropped to third with 2,513, while the American Southwest Conference (2,430) and the Northwest Conference (2,378) followed.
© 2010 The National Collegiate Athletic Association
Terms and Conditions | Privacy Policy