National Collegiate Athletic Association
NCAA News Archive - 2005
« back to 2005 | Back to NCAA News Archive Index
Athletics' share of overall spending still small
|
An NCAA study on capital expenditures for intercollegiate athletics shows that capital costs make up a significant portion of the money spent to run programs, but total athletics spending remains a relatively small share of overall institutional budgets.
The study also indicates the possible presence of an "arms race" in capital expenditures -- at least in football capital spending within major Division I-A conferences -- but the magnitude of that arms race appears to be modest at best.
 The first-of-its-kind report, called "The Physical Capital Stock Used in Collegiate Athletics," looks at the cost to own or lease facilities, practice fields and parking lots associated with athletics. Capital costs are derived from the cost of replacing facilities combined with various estimates of depreciation and financing.
The report notes that seating capacity at Division I football stadiums may be the most reliable factor in determining overall annual capital costs, primarily because the biggest driver of capital costs is the replacement and renovation of facilities, and total replacement costs are driven largely by football stadiums.
Since football stadium capacity is widely and easily available, analysts believe they can monitor overall athletics capital costs simply by following changes in football stadium capacity. Football stadium capacity also can be used to generate historical data on annual capital costs by school, and those costs can then be used to examine whether a so-called "arms race" has taken place in capital expenditures.
The data in the new study suggest that the expansion of a stadium at one school within a conference may make it more likely that other schools within that same conference will expand their stadiums. But the finding is sensitive to specific assumptions employed in the analysis, and the practical implications appear to be limited, in any case, because the magnitude of the effect is small.
For example, under one specification, the data suggest that if the maximum capacity within one of the major conferences increases by 10,000 seats, the average predicted increase at other schools within that same conference is roughly 500 seats.
The capital-expenses report supplements a 2003 study titled "The Empirical Effects of Collegiate Athletics: An Interim Report," which collected operating-expense data over an eight-year period to test the validity of a number of commonly held assumptions about intercollegiate athletics. That study noted that athletics operating budgets are a small portion -- about 3.5 percent -- of Division I-A university budgets. In addition, it found that increased spending does not raise winning percentages or revenues.
While that study was valuable in examining trends in operating expenses, it did not capture data in capital expenditures, an area many people thought would support the notion of an arms race in college sports. Capital costs are not readily available through data collected as part of the federal Equity in Athletics Disclosure Act, the source of operating data used in the 2003 study.
 Thus, the NCAA commissioned economists Jonathan and Peter Orszag of Competition Policy Associates, Inc., who co-authored the 2003 study, to survey institutions about capital costs. The survey was funded, in part, by the Andrew W. Mellon Foundation.
The findings, based on survey responses from 56 institutions from Divisions I, II and III regarding 362 athletics facilities, show that capital costs only moderately increase the share of overall university budgets going to athletics.
"The inclusion of capital costs does not change the result that athletics are a small share of institutional spending," said NCAA President Myles Brand. "However, the magnitude of these costs is a sign that they should be closely monitored and used as a tool by college presidents, boards and athletics directors to make informed decisions about future investments."
Brand said the study would help the newly formed Presidential Task Force on the Future of Intercollegiate Athletics, a group charged with, among other things, examining fiscal-integrity issues in college sports (see related story, page 11).
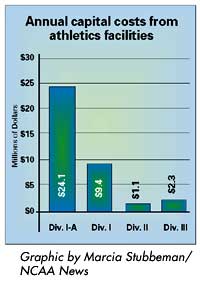
The study confirms that largest capital costs are in Division I-A, where institutions average $24 million. Division I-A schools already spend an average of $27 million on operating costs.
Division I as a whole spends about $9.4 million in capital costs; Division II spends roughly $1.1 million and Division III spends about $2.3 million each year.
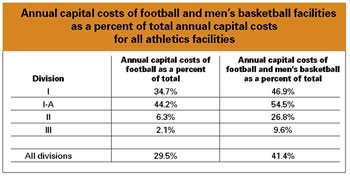
The largest portion of capital costs is spent on football, which accounts for about 29.5 percent in all divisions. That number is driven by Division I-A, which spends 44.2 percent of capital costs on football. Divisions II and III spend a much smaller portion -- 6.3 percent and 2.1 percent, respectively -- of capital costs on football.
Football and men's basketball combined account for nearly half of capital costs in Division I, with the division-wide total estimated at 46.9 percent and Division I-A estimated at 54.5 percent. The two sports make up a smaller portion of Divisions II and III, estimated at 26.8 percent and 9.6 percent, respectively.
Football and men's basketball account for 41.4 percent of capital costs across all three divisions.
© 2010 The National Collegiate Athletic Association
Terms and Conditions | Privacy Policy