National Collegiate Athletic Association
NCAA News Archive - 2003
« back to 2003 | Back to NCAA News Archive Index
|
The NCAA News
The annual NCAA Injury Surveillance System (ISS) report regarding fall sports reveals a slight decrease in the number of injuries in football.
The 2002 report also showed, however, that head injuries in multiple sports, heat illness in football and player contact injuries in soccer are a concern.
The system, developed in 1982, monitors injuries in 15 different sports, including five in the fall: football, women's soccer, men's soccer, women's volleyball and field hockey.
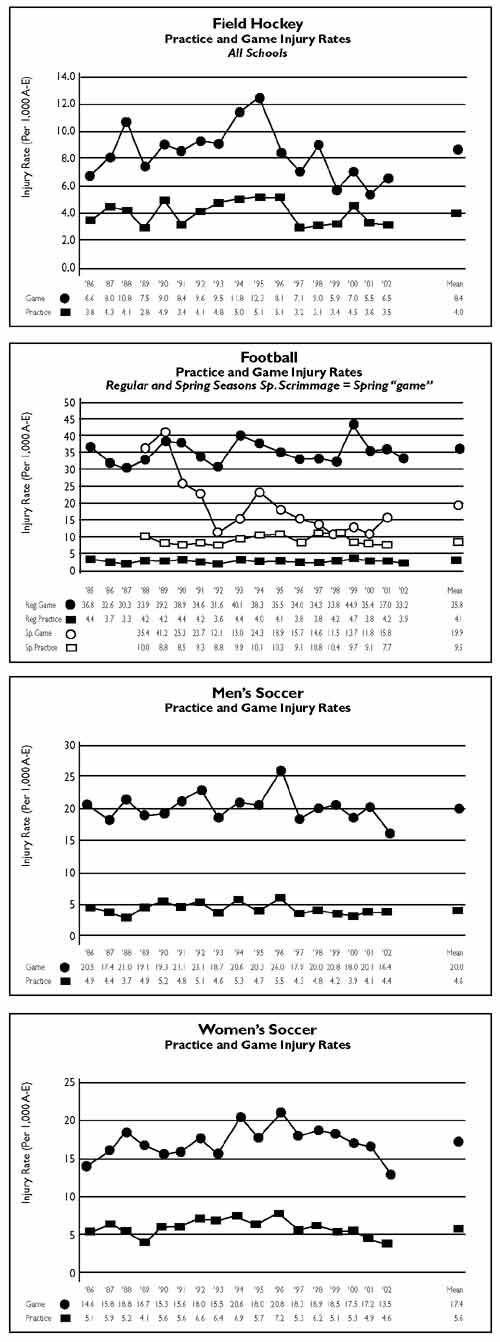
In football, practice (3.9) and game (33.2) injury rates per 1,000 athlete-exposures were slightly lower than the 19-year averages for the sport. Football game-injury rates equated to two injuries per game for a team of 60 participants. The game concussion rate of 3.25 (one concussion every five games for a team of 60 participants) reflected an increasing trend in the sport over the past several years. In addition, 87 percent of time-loss heat illnesses in football were reported on days when multiple practices occurred.
The knee, upper leg and ankle were the most prevalent body parts injured in football practice, accounting for 43 percent of all reported injuries while the knee, ankle and shoulder accounted for 51 percent of all reported game injuries. Sprains, contusions and strains were the top three types of injuries.
Forty-four percent of all game injuries required restricted or missed participation for seven days, or more while 10 percent of game injuries required surgery of some type. Full scrimmaging was the highest-risk practice activity, with an injury risk 2.5 times higher than other contact non-scrimmage activities.
Soccer injuries reduced
In other fall sports, women's soccer showed practice (4.6) and game (13.5) injury rates that were lower than the 17-year average for the sport. Assuming 15 game participants, the game rate equated to one injury every five games in the sport. The upper leg, ankle and knee were the top three body parts injured during practices, accounting for 61 percent of the reported injuries, while the ankle, knee, and head accounted for 63 percent of the reported injuries in game competition. Twelve percent of all reported game injuries were concussions. Strains, sprains and contusions were the top types of injuries in games.
Thirty-five percent of women's soccer game injuries restricted participation for seven days or more, while 10 percent resulted in surgery. Consistent with patterns that have been monitored since 1989, women soccer players had a 2.5 times higher risk overall of anterior cruciate ligament injury in games than men soccer participants. Fifty-eight percent of game injuries resulted from player contact, while 15 percent were associated with a slide tackle.
Men's soccer showed practice injury rates (4.4) slightly lower and game injury rates (16.4) significantly lower with the 17-year average for the sport. Assuming 15 game participants, the game rate equated to one injury every four games in the sport. The upper leg, ankle and knees were the most common body parts injured in practice, accounting for 53 percent of reported injuries, while those same three body parts were the most commonly injured in games, accounting for 49 percent of the injuries. Strains, sprains and contusions were the top three types of injuries in both practices and games. Concussions accounted for 6 percent of game injuries.
Twenty-nine percent of game injuries resulted in time loss of seven days or more, while 6 percent resulted in surgery. In games, player contact accounted for 61 percent of all injuries. Twenty percent of game injuries were associated with attempting or receiving a slide tackle.
Volleyball, field hockey
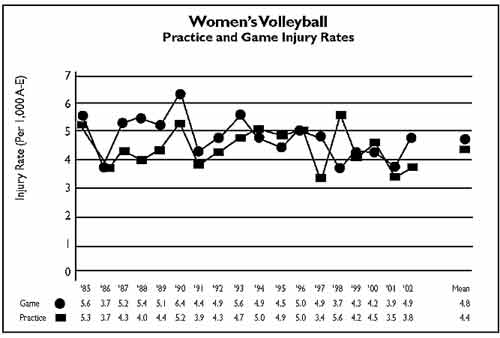
Women's volleyball is one of the few sports monitored that has game-injury rates that are similar to practice. The 2002-03 data show practice (3.8) and game (4.9) rates that were similar to the 20-year averages for the sport. Assuming eight game participants, the game rate equated to one injury every 25 games in the sport. The ankle, shoulder and knee were the most common body parts injured in practice, accounting for 43 percent of reported injuries, while the ankle, knee and shoulder accounted for 59 percent of the reported injuries in game competition. Sprains and strains were the top types of injuries.
Twenty-nine percent of game injuries resulted in time loss of seven days or more, while 9 percent resulted in surgery. Noncontact was the mechanism of injury in 48 percent of practice and 31 percent of game injuries. Player contact accounted for 28 percent of game injuries.
In field hockey, practice (3.5) injury rates and game (6.5) injury rates were lower than the 17-year averages for the sport. Assuming 15 game participants, the game rate equates to one injury every 10 games in the sport.
The upper leg, pelvis/hip/groin and ankle injuries were the top three body parts injured in practice, accounting for 58 percent of all practice injuries, while the head, ankle and knee accounted for 32 percent of the game-related injuries. Twenty-eight percent of all game injuries could be defined as above the neck (including face, nose, eyes, etc.), and 8 percent of those injuries were concussions. Strains, sprains and contusions accounted for 49 percent of reported injuries in games, while sprains, strains, and tendinitis accounted for 52 percent of the reported injuries in practice.
Thirty-one percent of game injuries resulted in time loss of seven days or more, while 10 percent resulted in surgery. Contact with the ball or stick accounted for 24 percent of all practice and 50 percent of all game injuries.
Additional information on the report is available from the sports sciences staff at the NCAA national office, or at www.ncaa.org/iss.html
© 2010 The National Collegiate Athletic Association
Terms and Conditions | Privacy Policy