National Collegiate Athletic Association
NCAA News Archive - 2003
« back to 2003 | Back to NCAA News Archive Index
|
The NCAA News
NCAA spring-sports injury data demonstrate downward trend
For the second year in a row, NCAA research on injury rates for spring sports indicates positive news.
Generally lower practice- and game-injury rates for five spring sports -- spring football, men's and women's lacrosse, baseball and softball -- highlight the spring 2003 NCAA Injury Surveillance System (ISS) report.
The study shows that practice- and game-injury rates were at least slightly lower than average in four of the five sports monitored. Women's lacrosse was the only sport in which rates were higher (game-injury rate only), and that increase was not an alarming one.
The ISS, in its 20th year, monitors injuries in 15 different sports, including the five in the spring. The ISS was developed in 1982 to provide current and reliable data on injury trends in intercollegiate athletics.
Spring football
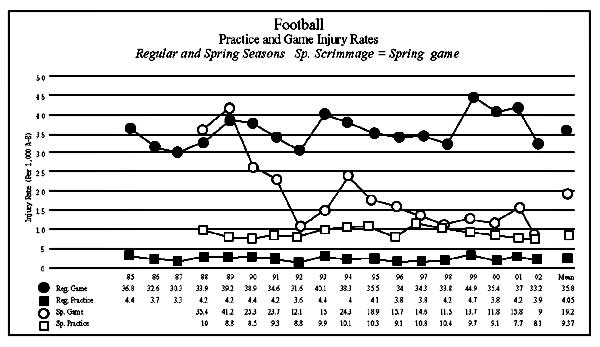
Practice (8.2) injury rates per 1,000 athlete-exposures were lower than the 15-year averages for the activity. This continues a downward trend over the last few years, with rates almost equivalent to preseason fall practice. Spring practice injury rates equate to one injury for every two practices for a team of 70 participants. The final spring "game" injury rate (9.0) also was significantly lower than average.
The knee, ankle and upper leg were the most prevalent body parts injured, accounting for 51 percent of all reported injuries. Sprains, strains and contusions were the top types of injuries.
Fifty-four percent of all spring practice injuries required restricted or missed participation for seven days or more while 12 percent required surgery of some type. Seven percent of the injuries involved concussions.
Lacrosse
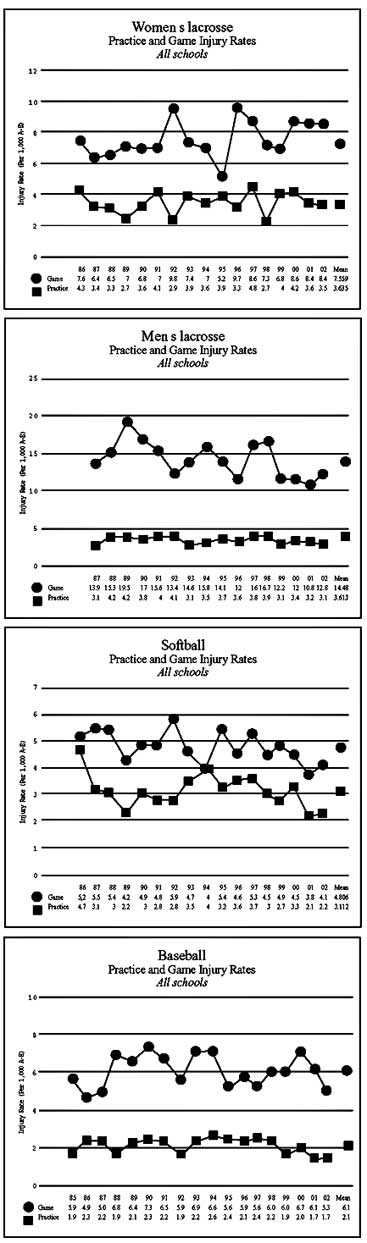
In men's lacrosse, practice (3.1) and game (12.8) injury rates were slightly lower than the 19-year averages for the sport. Assuming 15 game participants, the game rate equates to one injury every five games in the sport.
The ankle, upper leg and knee were the top body parts injured in practices, accounting for 49 percent of injuries. The upper leg, ankle and knee were the top body parts injured in games, accounting for 44 percent of injuries. Sixteen percent of all reported game injuries were above the neck, almost exclusively concussions. Sprains, strains and contusions were the top three types of game injuries.
Thirty-six percent of game injuries resulted in time loss of seven days or more, while 11 percent resulted in surgery. Almost half of game injuries resulted from player contact, while 15 percent were concussions.
Women's lacrosse showed practice (3.5) injury rates similar to and game (8.4) injury rates higher than the 17-year averages for the sport. Assuming 15 game participants, the game rate equates to one injury every eight games in the sport. The ankle, lower leg and upper leg were the top three body parts injured during practices, accounting for 46 percent of the reported injuries, while the ankle, knee and head accounted for 58 percent of the reported injuries in game competition. Twenty-four percent of all reported game injuries were above the neck, with 2 percent to the eye. Ten percent of game injuries were concussions. Sprains, strains and contusions were the top types of injuries in games.
Thirty-four percent of women's lacrosse game injuries restricted participation for seven days or more, while 14 percent resulted in surgery. Twenty percent of game injuries resulted from player contact; the same percentage resulted from contact with a stick.
Baseball
Baseball showed practice (1.7) injury rates and game (5.3) injury rates both slightly lower than the 18-year averages for the sport. Assuming 10 game participants, the game rate equates to one injury every 19 games in the sport. The shoulder, elbow and upper leg were the most common body parts injured in practice, accounting for 44 percent of reported injuries. The shoulder, upper leg and elbow were the top injuries in games, accounting for 39 percent of reported injuries. Strains, contusions and sprains were the top three practice and game injuries.
Forty-six percent of game injuries resulted in time loss of seven days or more, while 8 percent resulted in surgery. In games, pitching (17 percent) and non-contact (18 percent) accounted for the majority of injuries.
Softball
The 2003 softball data showed both practice (2.2) injury rates and game (4.1) injury rates lower than the 17-year averages for the sport. Assuming 10 game participants, the game rate equates to one injury for every 25 games. The shoulder, knee and ankle were the most common body parts injured in practice, accounting for 45 percent of reported injuries, while the ankle, knee and head accounted for 36 percent of the reported injuries in games. Strains, sprains and contusions were the top three types of injuries.
Thirty-eight percent of game injuries resulted in time loss of seven days or more, while 7 percent resulted in surgery. Twenty-two percent involved contact with an opposing player. Over one-fourth of all game injuries occurred to the baserunner.
How the ISS works
Exposure and injury data were submitted weekly by athletic trainers from institutions selected to represent a cross section of NCAA membership. The cross section was based on the three divisions of the NCAA and the four geographical regions of the country. The selected institutions amount to a minimum 10 percent sample of the membership sponsoring the sport; therefore, the resulting data should be representative of the total population of NCAA institutions.
An athlete exposure (A-E) is one athlete participating in one practice or game in which he or she is exposed to the possibility of athletics injury. For example, five practices, each involving 60 participants, and one game involving 40 participants would result in a total of 340 A-Es for a particular week.
A reportable injury in the ISS is defined as one that: (1) occurred as a result of participation in an organized intercollegiate practice or game, and (2) required medical attention by a team athletic trainer or physician, and (3) resulted in restriction of the student-athlete's participation or performance for one or more days beyond the day of injury.
The injury rate is a ratio of the number of injuries in a particular category to the number of athlete exposures in that category. This value is then multiplied by 1,000 to produce an injury rate per 1,000 athlete exposures. For example, six reportable injuries during a period of 563 athlete exposures would give an injury rate of 10.7 injuries per 1,000 athlete exposures (6 divided by 563) x 1,000.
Additional information on the report is available from the health and safety staff at the NCAA national office.
© 2010 The National Collegiate Athletic Association
Terms and Conditions | Privacy Policy