National Collegiate Athletic Association
NCAA News Archive - 2002
« back to 2002 | Back to NCAA News Archive Index
Basketball, ice hockey, wrestling and gymnastics see improvement
|
The NCAA News
The NCAA's latest Injury Surveillance System (ISS) reports generally lower practice and game injury rates for winter sports.
The study shows that practice and/or game injury rates were at least slightly lower than average in men's and women's basketball, men's ice hockey, wrestling and women's gymnastics.
The system, in its 19th year, monitors injuries in 15 different sports, including six in the winter season: men's and women's basketball, wrestling, men's and women's ice hockey, and women's gymnastics.
The survey, conducted as part of the ISS, provides a baseline of injury data from a national sampling. Researchers should be cautious when comparing ISS results with injury data from other studies.
No common definition of injury, measure of severity or evaluation of exposure exists in athletics-injury literature. The information in the summary must be evaluated under the definitions and methodology outlined for the ISS.
The ISS was developed in 1982 to provide current and reliable data on injury trends in intercollegiate athletics.
Injury data are collected yearly from a representative sample of member institutions and the resulting data summaries are reviewed by the NCAA Committee on Competitive Safeguards and Medical Aspects of Sports.
The committee's goal continues to be to reduce injury rates through suggested changes in rules, protective equipment or coaching techniques, based on ISS data.
Basketball
In men's basketball, practice (4.0) and game (8.6) injury rates were slightly lower than the 14-year averages for the sport. Assuming 10 game participants, the game rate equates to one injury every 12 games in the sport.
The ankle, knee and upper leg were the top body parts injured in practice and games, accounting for 48 percent of the game-related injuries. Sprains, contusions and strains were the top three types of injuries.
Thirty-three percent of game injuries resulted in time loss of seven days or more, while 10 percent resulted in surgery. Contact with another player accounted for 58 percent of all game injuries.
Women's basketball also had practice (3.8) and game (8.0) injury rates that were slightly lower than the 14-year averages for the sport. Assuming 10 game participants, the game rate equates to one injury every 13 games in the sport.
The ankle, knee and foot were the top body parts injured in practice and games, accounting for 49 percent of the game-related injuries. Sprains and strains were the top types of injuries. Women basketball players had a 3.5 times higher risk of anterior cruciate ligament injuries than their male counterparts.
Thirty-six percent of game injuries resulted in time loss of seven days or more, while 15 percent resulted in surgery. Contact with another player accounted for 39 percent of all game injuries.
Ice hockey
Women's ice hockey showed practice (4.3) and game (17.2) injury rates that were higher than the two-year average for the sport. Assuming 15 game participants, the game rate equates to one injury every 3.8 games in the sport. The pelvis/hip, lower back and shoulder injuries were the top three body parts injured during practices, accounting for 43 percent of the reported injuries, while the shoulder, ankle and head accounted for 47 percent of the reported injuries in game competition. Eleven percent of all reported game injuries were concussions. Sprains, contusions and strains were the top types of injuries in games.
Thirty-two percent of women's ice hockey game injuries restricted participation for seven days or more, while 10 percent resulted in surgery. Fifty-three percent of game injuries resulted from player contact.
Men's ice hockey showed practice (2.0) injury rates that were slightly lower and game injury rates (19.7) that were higher than the 16-year averages for the sport. Assuming 15 game participants, the game rate equates to one injury every 3.4 games in the sport. The pelvis/hip, shoulder and head were the most common body parts injured in practice, accounting for 45 percent of reported injuries. The shoulder, knee and head were the top three body parts injured in games. Strains, sprains and contusions were the top three types of injuries in practices. Concussions accounted for 13 percent of game injuries.
Forty-one percent of game injuries resulted in time loss of seven days or more, while 5 percent resulted in surgery. In games, player contact accounted for 48 percent of all injuries
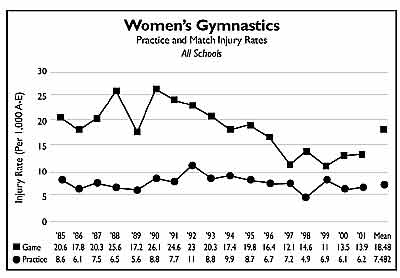
Gymnastics
The 2001-02 women's gymnastics data show slightly lower practice (6.2) and meet (13.9) injury rates than the 17-year averages for the sport. Assuming eight game participants, the game rate equates to one injury every nine meets in the sport. The ankle, knee and foot were the most common body parts injured in practice, accounting for 40 percent of reported injuries, while the knee, ankle and head accounted for 62 percent of the reported injuries in meets. Sprains, strains and contusions were the top three types of injuries.
Forty-one percent of meet injuries resulted in time loss of seven days or more, while 12 percent resulted in surgery. Dismount and landing were the top mechanisms.
A final report was not generated in men's gymnastics because of insufficient data.
Wrestling
Practice (5.8) and match (24.4) injury rates per 1,000 athlete-exposures were lower than the 17-year averages for the sport. Wrestling match-injury rates equate to one injury every four matches for a team of 10 participants.
The knee, shoulder and face were the most prevalent body parts injured in practice, accounting for 36 percent of all reported injuries, while the knee, shoulder and ankle accounted for 57 percent of all reported match injuries. Skin infections accounted for almost one-third of the practice time loss events. Sprains and strains were the top two types of match injuries.
Fifty-seven percent of all match injuries required restricted or missed participation for seven days or more, while 13 percent of match injuries required surgery of some type. Takedown was the highest-risk match activity with a risk of injury three times higher than any other move.
How the ISS works
Exposure and injury data were submitted weekly by athletic trainers from institutions selected to represent a cross section of NCAA membership. The cross section was based on the three divisions of the NCAA and the four geographical regions of the country. The selected institutions amount to a minimum 10 percent sample of the membership sponsoring the sport; therefore, the resulting data should be representative of the total population of NCAA institutions.
The system does not identify every injury that occurs at NCAA institutions in a particular sport. Rather, it collects a sampling that represents a cross section of the NCAA.
An athlete exposure (A-E) is one athlete participating in one practice or game in which he or she is exposed to the possibility of athletics injury. For example, five practices, each involving 60 participants, and one game involving 40 participants, would result in a total of 340 A-Es for a particular week.
A reportable injury in the ISS is defined as one that:
Occurred as a result of participation in an organized intercollegiate practice or game; and
Required medical attention by a team athletic trainer or physician; and
Resulted in restriction of the student-athlete's participation or performance for one or more days beyond the day of injury.
The injury rate is a ratio of the number of injuries in a particular category to the number of athlete exposures in that category. This value is then multiplied by 1,000 to produce an injury rate per 1,000 athlete exposures. For example, six reportable injuries during a period of 563 athlete exposures would give an injury rate of 10.7 injuries per 1,000 athlete exposures (6 divided by 563) x 1,000.
Additional information on the report is available from the health and safety staff at the NCAA national office.
© 2010 The National Collegiate Athletic Association
Terms and Conditions | Privacy Policy