National Collegiate Athletic Association
NCAA News Archive - 2002
« back to 2002 | Back to NCAA News Archive Index
|
The NCAA News
The latest study of revenue and expense trends at Divisions I and II institutions shows that fewer elite programs are making a "profit" but that those in the black are making more money than before.
The 2001 version of "Revenues and Expenses of Divisions I and II Intercollegiate Athletics Programs" (PDF*) reveals that 40 Division I-A programs showed revenues over expenses, compared to 48 in the 1999 study. However, the average profit for those 40 institutions grew substantially, increasing from $3.8 million in 1999 to $5.3 million in 2001.
Conversely, the number of Division I-A programs operating at a deficit increased from 56 programs in 1999 to 74 programs in 2001. At the same time, the average deficit for I-A institutions operating at a loss increased from $3.3 million in 1999 to $3.8 million in 2001.
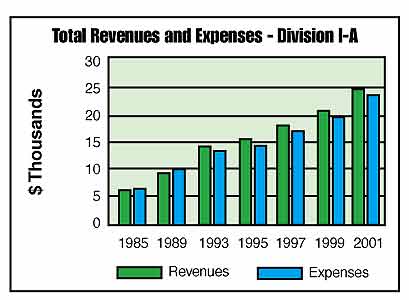
Not counting institutional support, total revenue in Division I-A was up 13 percent from 1999 to 2001, while total expenses increased by 16 percent.
The cost of salaries (28 percent) and grants-in-aid (15 percent) made up 43 percent of the average expense of a Division I-A program in 2001, while ticket sales and cash contributions constituted 44 percent of all revenue at I-A institutions.
"The revenue sources are especially interesting," said Daniel L. Fulks, accounting program director at Transylvania University and director of the study, which is conducted every other year. "There may be a misperception that big-time athletics programs are funded to a large degree by bowl money and NCAA distributions, but that clearly is not the case."
Instead, a typical Division I-A institution acquires 26 percent of its revenue from ticket sales and another 18 percent from cash contributions from alumni and others. The latter figure may include payments for the rights to purchase season tickets, along with revenue from skyboxes at certain stadiums.
NCAA and conference distributions account for only 9 percent of revenue for a typical Division I-A institution.
"The media frequently cite the size of the NCAA's contract with CBS and Bowl Championship Series revenue when they are seeking to illustrate the money associated with college athletics," Fulks said. "But this study shows institutional reliance on that money is rather limited and that programs are driven instead primarily through ticket sales and alumni donations."
While the number of I-A programs showing a profit is declining, the amount of profit for those programs in the black is accelerating rapidly. The average profit increased 38 percent over the previous study; even more notably, it has increased 209 percent since the 1997 report.
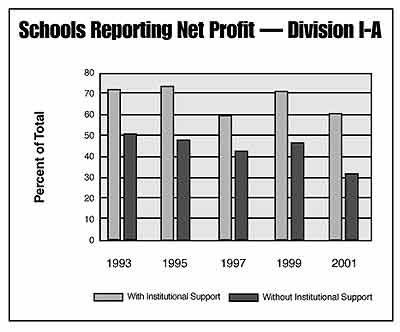
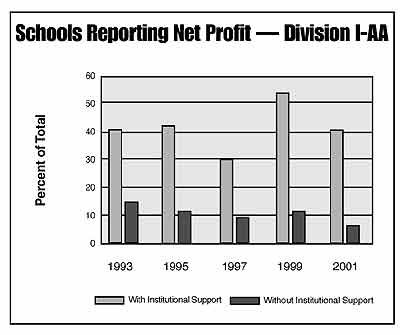
 "Of course, those rapidly escalating profits apply to an increasingly limited group," said Fulks, who noted that in the 1993 report, 51 percent of all I-A programs made money, as compared to 35 percent in the 2001 report. "In fact, most I-A programs now are operating at a loss and that average loss is about 14 percent larger than it was two years earlier."
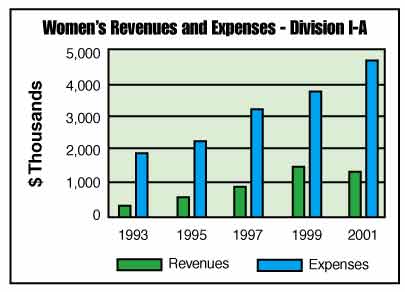
One area in which expenses are up -- appropriately so, in the eyes of many -- is for women's programs. Institutional outlays for women's programs at the I-A level have risen steadily since the 1993 report, when they averaged $1.8 million. In 1995, that figure climbed to $2.3 million, then to $3.1 million in 1997, $3.9 million in 1999 and finally $4.6 million in 2001. So, since 1993, women's expenses for a typical I-A program have increased by about 156 percent.
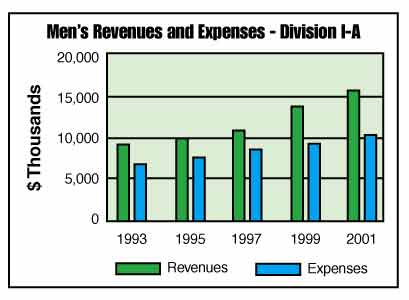
During the same time, men's expenses also increased, although at a slower rate. In 1993, men's average expenses were $7.0 million, and by 2001, they had climbed to $10.9 million, an increase of about 56 percent.
Division I-AA challenges
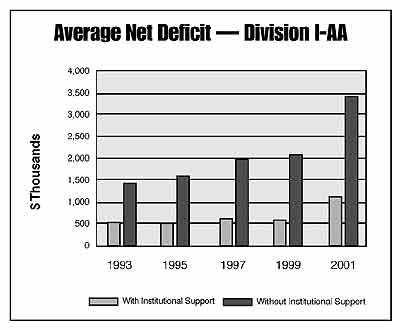
The study also revealed a challenging economic climate in Division I-AA that is similar to the environment for many smaller I-A institutions. The average Division
I-AA program operated at a $3.4 million loss in 2001, a 55 percent increase over 1999. Average revenues in Division I-AA increased about 6.3 percent from the 1999 study, but average expenses soared by 25.9 percent.
From 1993 to 1995, 1995 to 1997 and 1997 to 1999, the average loss for a typical Division I-AA program did not increase by more than $300,000 in any reporting period. However, the average loss in Division I-AA increased by $1.2 million from 1999 to 2001 (from $2.2 million to $3.4 million).
"Just like Division I-A programs,
I-AA programs are affected by increasing salaries and financial aid expenses," Fulks said. "However, revenue in I-AA simply has not kept pace. It has increased only 36 percent since 1993. During the same period, expenses have increased by 72 percent."
Division I-AAA (nonfootball) programs also operated at a deficit in 2001. The average I-AAA program lost $2.8 million in 2001, a 12 percent increase from 1999. Division II programs with football averaged $1.3 million in losses in 2001 (up 13 percent) while Division II nonfootball programs lost an average of $1.1 million (up 22 percent).
Football profitability
The study also revealed that 69 percent of Division I-A football programs (79 programs) showed an average profit of $7.4 million. Division I-A football programs that lost money averaged about $1.3 million in losses in 2001. Three programs reported breaking even in football.
Men's basketball programs at Division I-A institutions also tended to make money, with 66 percent showing revenues over expenses. For I-A women's basketball, 5 percent made a profit, down from 9 percent in 1999, primarily because expenses are accelerating more rapidly than revenue.
The study also illustrated the financial difference in large and small Division I-A programs. In total revenue, the bottom 10 percent ranged from $4.3 million to $9.8 million annually. The top 10 percent, however, averaged revenue between $43.5 million and $79.6 million annually.
The same gap was apparent in expenses, where the bottom 10 percent spent between $6.2 million and $10.3 million while the top 10 percent spent between $38.8 million and $52.1 million.
© 2010 The National Collegiate Athletic Association
Terms and Conditions | Privacy Policy