National Collegiate Athletic Association
NCAA News Archive - 2008
« back to 2008 | Back to NCAA News Archive Index
|
The NCAA News
The NCAA’s latest research on spending at Division I institutions shows that athletics’ reliance on institutional subsidy to balance the budget is growing.
The three-year report indicates that in 2004, the average Football Bowl Subdivision institution received about 19 percent of total revenue from allocated sources. In 2006, that proportion was up to 25 percent. In the Football Championship Subdivision, about 75 percent of revenues come from allocated sources – a proportion that has been fairly constant over the three years studied. At Division I institutions without football, almost 80 percent of revenues come from allocated sources.
Only 19 FBS programs generated revenues that exceeded expenses in the 2006 fiscal year, and just 16 reported positive net revenue over the three-year aggregate. The median positive net revenue for the 19 institutions in that category in 2006 was $4.3 million. By contrast, the median negative net revenue for the other institutions within the FBS was about $8.9 million, exposing a gap (about $13.2 million in 2006) that has grown by about $2 million since 2004.
The 2004-06 report is as notable for its methodology as it is for its message. The NCAA has researched revenue and expenses since 1969, but this iteration of the report is the first that clarifies the terminology under which the data are collected. The NCAA partnered with the National Association of College and University Business Officers to enhance data collection and include salary and facility information not captured in previous reports. The report also for the first time distinguishes dollars that athletics departments generate on their own from those their universities allocate to them. That is a key distinction because it provides a truer indication of athletics’ reliance upon university subsidy and gives campus decision-makers a more informed review of their investment in athletics.
The report also more clearly defines “generated” and “allocated” revenue sources. Generated revenues (which are produced by the athletics department) include ticket sales, radio and television receipts, donor contributions, guarantees and other revenue sources that are not dependent upon entities outside athletics.
Allocated revenues include:
-
Student fees directly allocated to athletics;
-
Direct institutional support (financial transfers directly from the general fund to athletics);
-
Indirect institutional support (such as the payment of utilities, maintenance and support salaries by the institution on behalf of athletics); and
-
Direct governmental support (the receipt of funds from state and local government agencies that are designated for athletics).
Previous revenue and expenses reports garnered from Equity in Athletics Disclosure Act submissions did not make those distinctions, which produced unreliable facility and salary data by institution. As such, the 2004-06 report is not comparable to the revenue and expenses studies the NCAA conducted periodically since 1969. The latest report, though, will be used as a benchmark for future studies, which is why the report includes three years of data (so that comparisons can at least be made within the cohort).
Also significant in the new report is a change from reporting average data to median data. The change mitigates the impact that unusually large revenue items, primarily alumni and booster contributions, have had on average amounts in recent years. For example, Oklahoma State received a donation of almost $240 million in 2006 that had it been included in a calculation of averages would have skewed the entire cohort. The median approach reveals a truer view of the Division I landscape.
Other findings
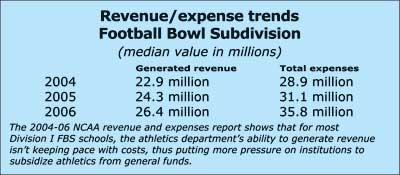
The fact that athletics is relying more on institutional subsidy is amplified by the finding that athletics expenses continue to outpace revenue over the three years of the report.
While revenues were up 16 percent for FBS schools, those same programs incurred a 23 percent increase in spending during the same period. The two largest expense items for the average Division I program are salaries and grants-in-aid. At the FBS level, salaries (for coaches and other athletics department employees) account for 32 percent of total expenses (17 percent are salaries to coaches and 15 percent are salaries to administrative staff), and grants-in-aid represent 16 percent of total expenses. In terms of salaries for specific head coaches, the median salary reported for men’s basketball coaches at FBS institutions was $611,900 (including institutional and third-party sources). For FBS head football coaches, the median in 2006 was $855,500. The median FBS institution spent an additional $1.46 million on salaries and benefits for assistant coaches in football.
As for revenue, two sources account for over 50 percent of total generated revenue – ticket sales and contributions from alumni and others. That holds true for all three subdivisions.
The expense-over-revenue pace is similar in the Football Championship Subdivision and for Division I institutions without football. In the FCS, median generated revenue increased 6 percent from 2005 to 2006 and 13 percent for the two years from 2004 to 2006. The median total expenses increased 10 percent from 2005 to 2006 and 23 percent for the two years from 2004 to 2006. The median deficit in 2006 was about $7.1 million, a figure that has increased in each of the last three years (from just under $6 million in 2004).
For Division I programs without football, the median generated revenue increased 13 percent from 2005 to 2006 and 22 percent for the two years from 2004 to 2006. The median total expenses increased 12 percent from 2005 to 2006 and 24 percent for the two years from 2004 to 2006. About 10 percent of the subdivision reported net generated expenses in men’s basketball, but none reported an entire athletics budget in the black.
But even with the growth in expenses that has occurred over the past few years, total athletics spending represents about 5 percent of total institutional expenses at the median FBS institution – a percentage that has been consistent over the period of this report.
Other findings in the report include:
- The median FBS football program generated about $10.6 million in revenue in 2006 (up from $8.3 million in 2004). The median for football program expenses was about $8.5 million (versus $7.5 million in 2004).
- The median FBS men’s basketball program generated about $4.0 million in revenue in 2006, and had $2.7 million in expenses. The revenue and expense numbers were up from $3.2 million and $2.5 million, respectively, in 2004.
- FBS women’s basketball teams reported median generated revenue of about $183,000 in 2006 (up from $149,000 in 2004). Median expenses for those teams were about $1.5 million (versus $1.4 million in 2004).
- Between 50 and 60 percent of FBS football and men’s basketball programs have reported net generated revenues (surpluses) for each of the three years reported. In the FCS, only 4 percent of football programs and 8 percent of men’s basketball programs reported net generated revenues for 2006, and those were minimal.
- For Division I programs without football, about 10 percent of men’s basketball programs reported net generated revenue for each of the three years, moving from $700,000 in 2004 to almost $1 million in 2006.
- In all subdivisions, the number of participating athletes remains fairly constant, while the expense per athlete continues to increase.
This release of revenue and expenses data compiled through more uniform reporting procedures is among the primary recommendations from the Presidential Task Force, which was formed two years ago and advocated collecting clearer and more comparable data to guide presidential decisions about athletics budgets. Task Force members believed in arming presidents with the best possible data rather than having them continue to rely on incomplete research or anecdotal evidence to evaluate their athletics spending.
“The Task Force was concerned about athletics’ accelerated budget growth but knew it couldn’t stress moderation without presenting the data in a way that was useful to decision-makers,” said NCAA Chief Financial Officer Jim Isch. “The new reporting procedures provide apples-to-apples comparisons in the aggregate and give presidents and chancellors a more informed foundation from which to base decisions.”
In effect, the report probably is the most accurate accounting of financial data the NCAA has ever provided. The report will form the foundation of the NCAA’s “dashboard indicators” project to be distributed later this year that also will contain financial data from the 2007 reporting year. The dashboard initiative is geared more toward educating presidents about aggregate trends than it is for public consumption, though, which is why the NCAA is releasing the revenues and expenses report separately.
The report is available here.