National Collegiate Athletic Association
NCAA News Archive - 2008
« back to 2008 | Back to NCAA News Archive Index
The NCAA News

The 2006-07 NCAA Student-Athlete Race and Ethnicity Report will debut a new approach to tracking international student-athletes when it is released in October.
To increase the accuracy of the data reflected in the research, the nonresident alien (foreign student-athlete) and race/ethnicity categories have been separated in the most recent edition of the report. In previous years, the categories have been combined, and although student-athletes could fall into any race or ethnic classification, they were identified only as nonresident aliens.
For example, a black student-athlete from Canada would have been classified only as a nonresident alien. However, under the new methodology, that student-athlete would be counted as part of a race/ethnicity classification and identified separately as a nonresident alien. An additional table has been added to the report to reflect the change in approach.
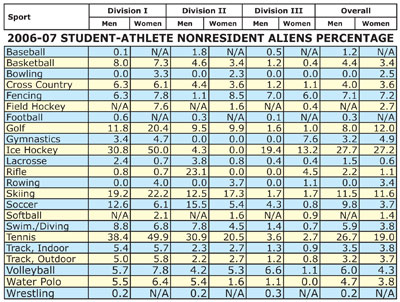
The percentage of male and female international student-athletes has increased since the report was originally published in 1999-00. The overall percentage of male nonresident alien student-athletes increased from 1.8 to 4 percent, and the percentage of female international student-athletes jumped from 1.5 to 4.5 percent.
NCAA research consultant Denise DeHass, who compiled the report, acknowledged that the change in the methodology could have influenced those numbers, particularly in sports such as tennis and ice hockey, in which more than 10 percent of the total participants are identified as nonresident aliens. Despite the shift in methodology, DeHass believes the upward trend is legitimate since the number of international student-athletes has been growing steadily since the report was established.
At the divisional levels, the percentage of male and female nonresident aliens competing in Division I rose from 2.4 percent for both in 1999-00 to 6.3 and 7.5 percent, respectively, in 2006-07. Over the same period, the percentage of international male and female student-athletes in Division II increased from 2.5 and 1.6 percent to 4.6 and 4.5 percent, respectively. While there also was an increase in male and female nonresident alien student-athletes in Division III, the report attributed the bump to the change in methodology since it occurred primarily between 2005-06 and 2006-07.
Ethnicity in rugby
Another new feature in this year’s report is data on the race and ethnicity of women’s rugby student-athletes. While rugby currently is designated only as an NCAA emerging sport, it registered the second-highest percentage of black female student-athletes in Division III at 12.9 percent, just behind basketball at 15.8 percent. Rugby also carried the highest percentage of Hispanic females (12.9) and American Indian/Alaskan Native females (2.2) in Division III, even though those two groups make up just 2.5 and 0.3 percent, respectively, of female student-athletes in the division.
The popularity of rugby among ethnic minority females is less apparent in the other divisions. In Division I, 90 percent of female rugby student-athletes were white, while Hispanic females made up the remaining 10 percent. In Division II, 100 percent of female rugby players were white.
Ethnicity in other sports
Overall, the recent figures indicate that white males and females continue to compose the largest percentage of student-athletes by a wide margin at 72.2 and 78.8 percent. Black males and females are the second-largest group of student-athletes at 18.3 and 11.2 percent.
Although the percentage of black and international basketball student-athletes has risen steadily between 1999-00 and 2006-07, overall, most male and female basketball players are white. Division I has the highest percentage of black male (60.4) and black female (47.4) basketball players. Division II has a higher percentage of black basketball players than white, though that proportion is reversed with female players. Most Division III basketball players are white (67.7 percent for males and 78.8 percent for females).
Notably, the percentage of international basketball student-athletes has doubled in Divisions I and II between 1999-00 and 2006-07. In Division I, the percentage of male international basketball players jumped to 8.7, up 5.7 percent since the report was launched, while the percentage of female international basketball student-athletes climbed to 7.3 percent, up from 2.4 percent eight years ago. There has been little change in the percentage of male and female international basketball players in Division III.
For the second year in a row, blacks edged whites as the largest percentage of Division I Football Bowl Subdivision players, 46.4 percent compared to 46.3 percent. Meanwhile, in the Football Championship Subdivision, the highest percentages of student-athletes were white (47.7 percent), followed closely by black student-athletes (45.2 percent).
In Divisions II and III, the highest percentage of football student-athletes were white.
Basketball, football and indoor and outdoor track carried the highest percentages of black male student-athletes overall and in each of the divisions. In Divisions I and II, bowling, basketball and indoor and outdoor track and field registered the highest percentages of black females. In Division III, the highest percentages for black females were found in basketball and rugby.
This is the eighth consecutive year the NCAA has issued the Student-Athlete Race and Ethnicity Report. To view, download or purchase the 2006-07 edition of the report, visit NCAAPublications.com.