The NCAA News - News and Features
The NCAA News -- December 21, 1998
Survey shows variation in graduation rates among divisions
The first set of graduation rates for Divisions II and III may be as interesting for what they show about the general student bodies as for what they reveal about student-athletes.
The report, which was mailed in mid-December, shows a significant variance among the three divisions in overall graduation rates.
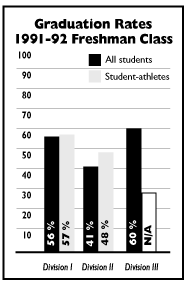
For the class that entered college in 1991-92, 56 percent of the general student body at Division I institutions graduated within six years. In Division II, that percentage was 41 percent while in Division III, it was 60 percent.
The survey tracks only athletes receiving athletically related financial aid, so no significant data are available for Division III student-athletes. However, the survey shows that Division II athletes are graduating at a rate significantly higher than their non-athlete peers.
Todd A. Petr, NCAA director of research, says that thevariation in rates from division to division may have more to do with institutional mission and student demographics than with anything else. For instance, Division III has by far the highest percentage of students in private institutions:
|
Public |
Private
|
| Division I |
82.7% |
17.3%
|
| Division II |
79.7% |
20.3%
|
| Division III |
36.2% |
63.8% |
Conversely, many Division II institutions may have broader admission policies that are designed to make higher education more accessible, Petr said.
The important figure to note in Divisions I and II is the difference between the graduation rate for students and student-athletes, he said. That is a direct comparison of students at the same group of schools. In Division II, you will note that not only do the student-athletes significantly outperform the student body in general, they do so in every major subset.
The 1991-92 freshman class of Division II student-athletes graduated at a 48 percent rate -- seven percent higher than the overall student body.
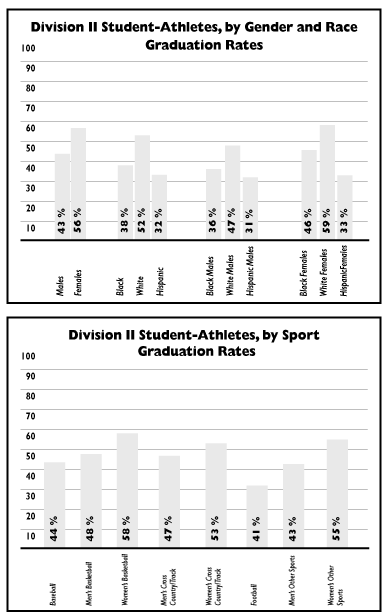
Petr also said that although the graduation rates for Division II student-athletes do not match those for Division I, the percentage by which they outperform the general student body is larger in Division II in every major category:
| Division II Group |
Student body |
Student-athletes
|
| Males |
37% |
43%
|
| Females |
44% |
56%
|
| White males |
40% |
47%
|
| White females |
47% |
59%
|
| Black males |
28% |
36%
|
| Black females |
34% |
46% |
The graduation rates for the same groups in Division I:
| Division I Group |
Student body |
Student-athletes
|
| Males |
53% |
51%
|
| Females |
58% |
67%
|
| White males |
56% |
56%
|
| White females |
60% |
70%
|
| Black males |
34% |
41%
|
| Black females |
45% |
56% |
Until now, Divisions II and III have reported only persistence rates rather than actual graduation rates. That was because Divisions II and III institutions did not necessarily have the records needed to provide graduation information on student-athletes when the requirement for such reporting was established in 1991-92. The reports had to be built from scratch over a six-year period.
The reports are required by NCAA Bylaw 13.3.1 and the Federal Student Right-to-Know Act.
The figures are a conservative representation of the graduation rate. Only student-athletes who enroll as freshmen, receive athletically related financial aid and who graduate from that institution within six years of initial enrollment are tracked. Student-athletes who transfer in good academic standing and who graduate elsewhere count against their original institution as not graduating. They also are not counted in the freshman cohort for their second institution.
The report is provided to 27,000 high schools across the country to assist prospective student-athletes, parents and counselors.
Petr said that while the information is highly valuable, some caution should be used in interpreting the data.
It is especially important to consider the mission of a particular institution in looking at these data, he said. Colleges and universities with broader admissions policies understandably may have lower graduation rates than those with more restrictive standards. However, each individual should weigh many factors when deciding which institution is appropriate.
Petr also warned that data from individual institutions can be misleading because some of the subsets that are surveyed are so small. For instance, it is possible that for a particular reporting period, only one student-athlete may fit a particular description (for example, black female basketball players). In such cases, the graduation rate is either 0 or 100 percent, depending on whether the student-athlete graduates. In such cases, Petr said, the figure has little meaning.


|