Latest graduation study leaves a mixed message
1991 Division I class exceeds nonathlete rate, but decline shown with certain groups
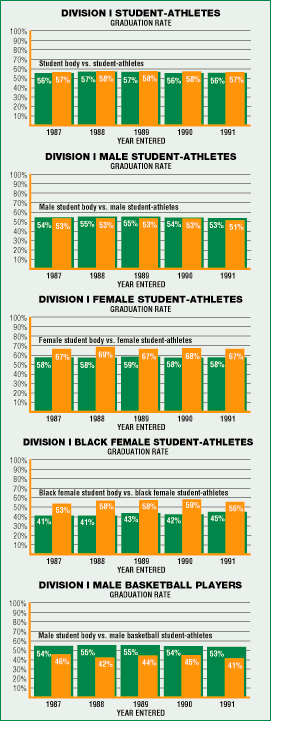
Division I student-athletes who entered college in 1991 represent the sixth consecutive class that graduated at a higher rate than the general student body.
 The class of student-athletes that entered an NCAA institution as freshmen in 1991 graduated at a rate of 57 percent, one percent lower than the 1990 class, but still one percent higher than the general student body.
Each class of student-athletes since 1986, the first year that Proposition 48 academic standards went into effect, has graduated at a higher rate than the general student body.
"The NCAA's efforts to increase academic standards for incoming student-athletes are having a positive effect," said NCAA President Cedric W. Dempsey. "I am pleased to see that NCAA student-athletes are consistently achieving strong graduation rates."
Large differential
Black female student-athletes, who traditionally have graduated at a much higher rate than the black female student body, did so again at a rate of 56 percent, 11 percent higher, which was the largest differential in rates between student-athletes and the general student population.
Both white female student-athletes and black male student-athletes also graduated at rates significantly higher than their counterparts in the overall student body. White female student-athletes were 10 percent above overall Division I rates for the 1991 class (70 percent to 60 percent) while black male student-athletes posted a 41 percent graduation rate compared to 35 percent within the general student body.
White male student-athletes and white males in the general student body graduated at the same rate, 56 percent, which represents a one percent decline for the 1991 class.
The largest decline was among male basketball players, who dropped from 45 percent in 1990 to 41 percent in 1991. This decline seems to be primarily caused by the large drop in graduation by white male basketball players, who graduated at a rate of 47 percent -- their lowest since 1984 when the NCAA began tracking student-athlete graduation rates.
Division I-A football players also showed declines in graduation rates for the second consecutive year. The graduation rate for Division I-A football players entering in 1991 was 50 percent, down from 52 percent for players entering in 1990.
In general, however, student-athletes entering in 1991 are still graduating at rates slightly higher than students of the same racial and gender group.
New procedure
The data, as collected from all Division I member colleges and universities and published in the 1998 NCAA Division I Graduation-Rates Report, are conservative representations of the graduation rate. Only student-athletes who enroll as freshmen, receive athletics related financial aid, and who graduate from that institution within six years of initial enrollment are tracked.
Student-athletes who transfer in good academic standing and graduate elsewhere count against their original institution as not graduating and are not counted in the freshman cohort rate for their second institution.
Also, 1998 marked a change in the way graduation rates are compiled. It is the first year of data collection using the government-supplied Integrated Postsecondary Education Data System (IPEDS) graduation rate survey. The IPEDS is similar to the instrument formerly used by the NCAA but changes in definitions and reporting requirements may cause slight changes in the data.
The NCAA compiles and publishes annually graduation rates for Division I member institutions. The Division I report is distributed to 27,000 high schools for use by guidance counselors, coaches, students and parents. The report also is sent to higher education leaders, members of Congress and the media.
Graduation-rate data for Divisions II and III will be published for the first time later this fall.
Caution about interpretation
It should be noted that care should be taken in applying graduation-rate data to individual institutions.
Individual missions vary among member institutions, which results in particular populations from which each school draws its students. In some cases, a lower graduation rate may be easily explainable.
Also, when comparing percentages from sport to sport, some of the sets being measured are quite small. For example, it is not uncommon for a basketball team to have only one senior, which means the graduation rate for that team for that year would be 100 percent or 0 percent, depending on whether the athlete graduated. Neither percentage would be especially significant in such a case.