The NCAA News - News and FeaturesFebruary 2, 1998
Large eligibility differences noted by race, income
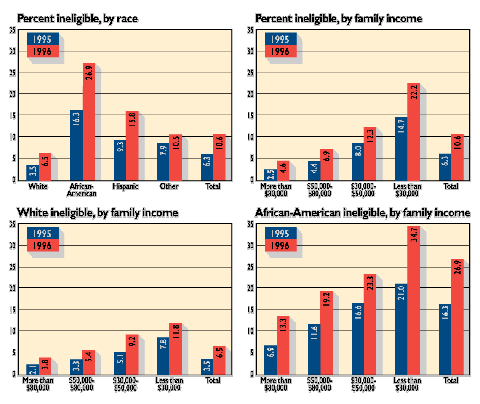
Recently published research from the NCAA indicates that there are large differences among ethnic and income groups in eligibility rates for freshmen at NCAA Division I institutions.
 NCAA Research Report 97-04 examines the group of prospective student-athletes (PSAs) who applied to the NCAA Initial-Eligibility Clearinghouse in 1995 or 1996 and who appeared on at least one Division I institutional request list during the recruiting process. The report adds specific demographic information based on ethnicity and income to previous descriptions on the academic performance of prospective student-athletes (see the January 26 issue of The NCAA News). NCAA Research Report 97-04 examines the group of prospective student-athletes (PSAs) who applied to the NCAA Initial-Eligibility Clearinghouse in 1995 or 1996 and who appeared on at least one Division I institutional request list during the recruiting process. The report adds specific demographic information based on ethnicity and income to previous descriptions on the academic performance of prospective student-athletes (see the January 26 issue of The NCAA News).
Todd A. Petr, NCAA director of research, noted that the quality of the research information is limited by the many common problems of large-scale self-report studies, such as the need to match up a variety of computerized records, incomplete data and overestimation of income. However, he said that given those basic limitations, some systematic trends were observed.
The study divides the population of PSAs into groups based on the student-athletes' self-reported ethnicity and family-income level.
"Self-report income data can be tricky," Petr said. "However, the trends were very strong, and there was evidence from other sources that corroborated our findings, so we present these data with confidence that the overall pattern of effects seen is reliable."
The report compares the ineligibility rates in 1995 with those in 1996. Petr said the comparison is important because of the changes in NCAA initial-eligibility legislation that occurred in fall 1996.
Basic findings from the report include:
* The largest numbers of PSAs declared ineligible were found in the self-reported white non-Hispanic and African-American groups, and those numbers have increased over time.
* The largest percentages of PSAs declared ineligible were found in the self-reported African-American group, and those numbers have increased over time.
* The self-reported family-income variable again shows a clear trend for lower income levels to be associated with larger ineligibility frequencies and percentages.
* In comparison to the 1995 cohorts, all impacts on the 1996 cohorts are larger, and some impacts are more than twice as large.
* There seem to be independent effects of both ethnicity and income on ineligibility rates. That is, given the same family-income level, a higher proportion of African-American student-athletes will be declared ineligible than their white non-Hispanic counterparts.
The differences in ineligibility rates for different demographic groups may be considered as a direct reflection of the differences in the distributions of pre-college academic performance variables (for example, core grade-point averages and test scores). Those and other group differences in academic performances have been observed in previous research conducted by the NCAA.
Petr indicated that several reasons could exist for the changes in ineligibility rates from 1995 to 1996.
"It could be due to changes in the applicant pool, the way the Division I schools used the institutional request list mechanism during these years, or the imposition of the new indexing requirements," he said.
Petr said that it was not possible to analyze the independent impacts of those issues within the current data set.
Ineligibility Decisions Under NCAA Bylaw 14.3 for Self-Reported Ethnic Groups
(Prospective Division I Student-Athletes in 1995 and 1996)
1995 Division I -- -- -- Reasons--Within Group %
Subgroup -- Any -- Courses -- Grades -- Tests -- Index
1. White -- 3.5 -- 2.2 -- 1.3 -- 0.9 -- 0
2. African-American -- 16.3 -- 8.7 -- 5.9 -- 9.1 -- 0
3. Hispanic -- 9.3 -- 6.2 -- 1.8 -- 4.1 -- 0
4. Other -- 7.9 -- 5.7 -- 2.5 -- 2.8 -- 0
Total Division I -- 6.3 -- 3.8 -- 2.3 -- 2.6 -- 0
1996 Division I -- -- -- Reasons--Within Group %
Subgroup -- Any -- Courses -- Grades -- Tests -- Index
1. White -- 6.5 -- 3.7 -- 1.0 -- 1.4 -- 1.7
2. African-American -- 26.9 -- 10.2 -- 5.4 -- 14.3 -- 6.8
3. Hispanic -- 15.8 -- 7.9 -- 1.8 -- 6.1 -- 4.0
4. Other -- 10.5 -- 6.3 -- 1.0 -- 3.8 -- 1.7
Total Division I -- 10.6 -- 5.2 -- 1.8 -- 3.8 -- 2.7
|